I have been working a lot on Mortality Watch lately and now finally got it to a point where I would call it complete. So let’s take a look at a variety of charts that you can easily generate now!
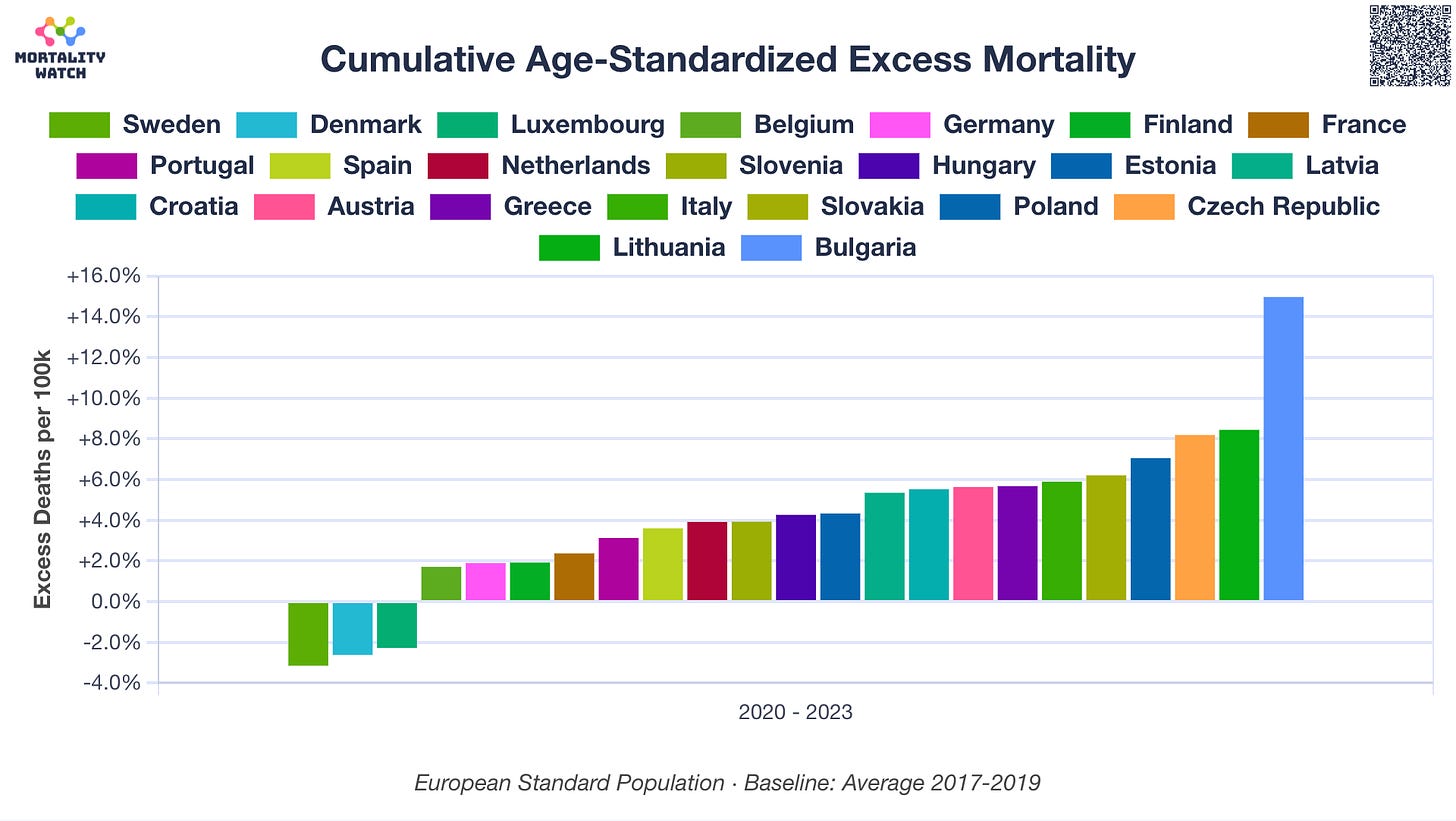
1. Excess Mortality in the EU during COVID-19
With a three-year average pre-pandemic baseline, Sweden saw the lowest Excess Mortality in the European Union.
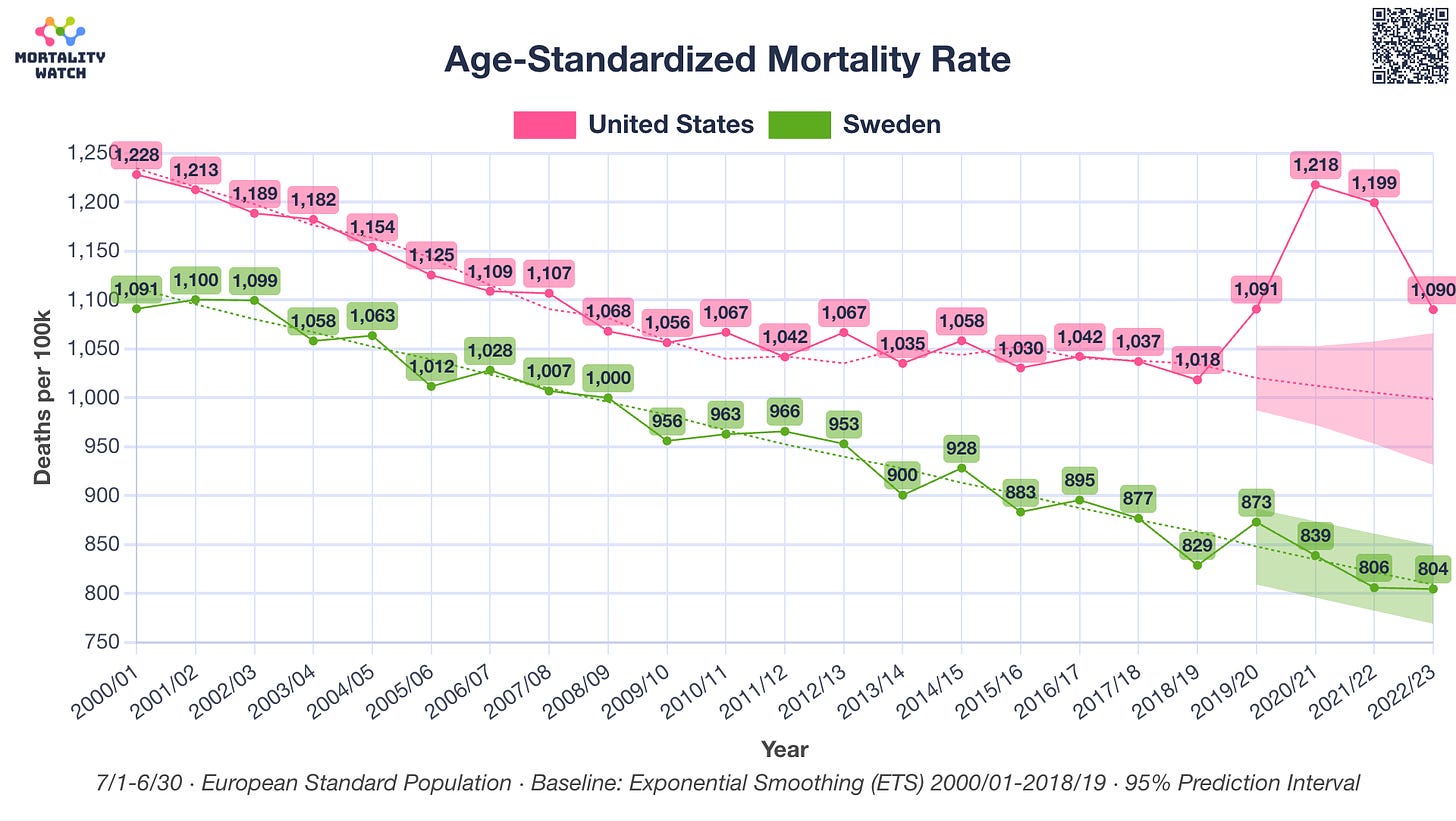
2. Mortality in the USA & Sweden since 2000/'01
Age-standardized mortality by midyear seasons (Jul-Jun) shows no significant mortality increase in Sweden, in contrast to the USA.
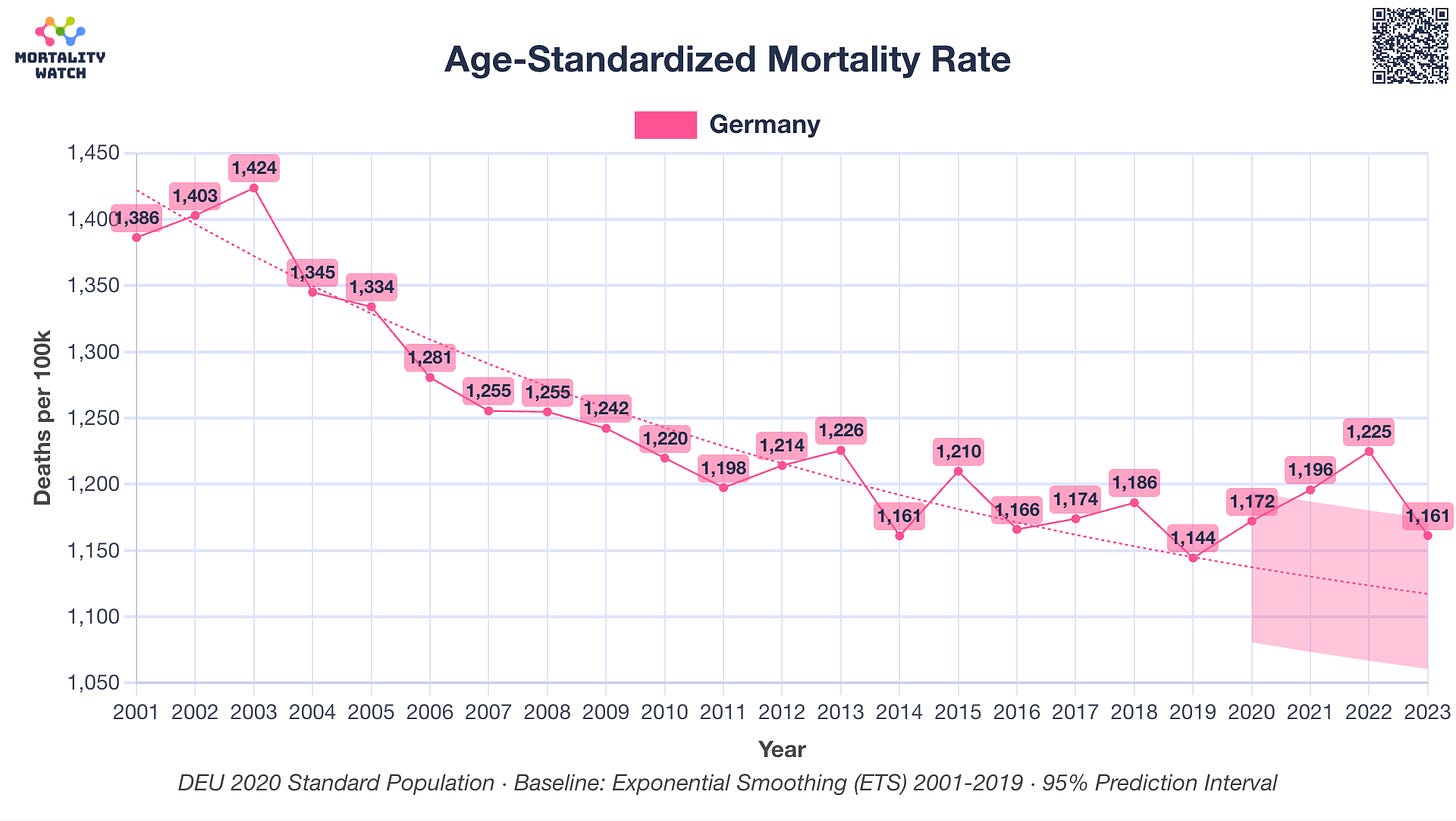
3. Mortality in Germany since 2001
Yearly age-standardized mortality shows no significant increase in Germany during 2020, in contrast to the following two years of 2021/'22.
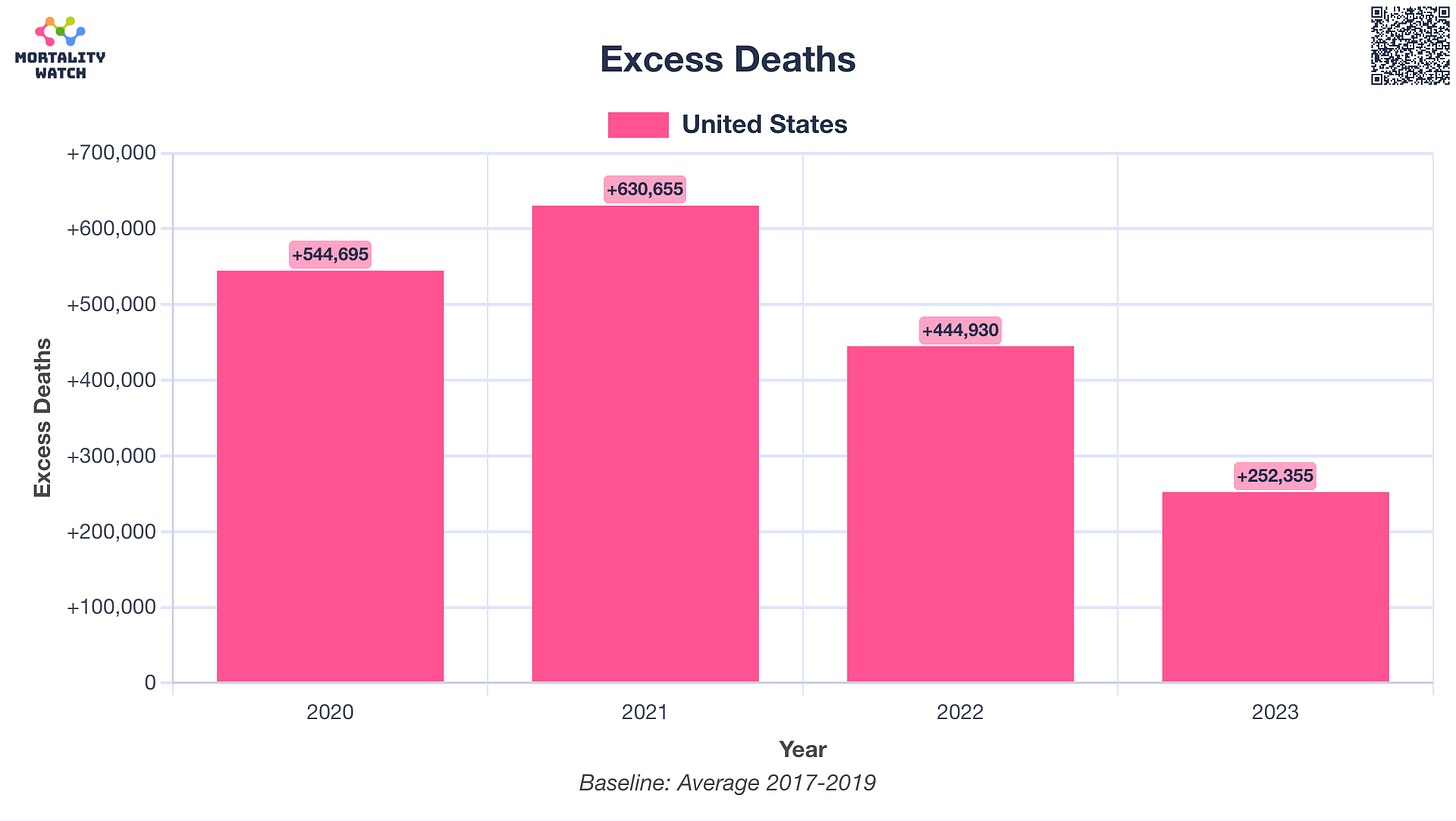
4. Excess Deaths in the USA during COVID-19
During the COVID-19 Pandemic, the USA recorded over a million more deaths than projected.
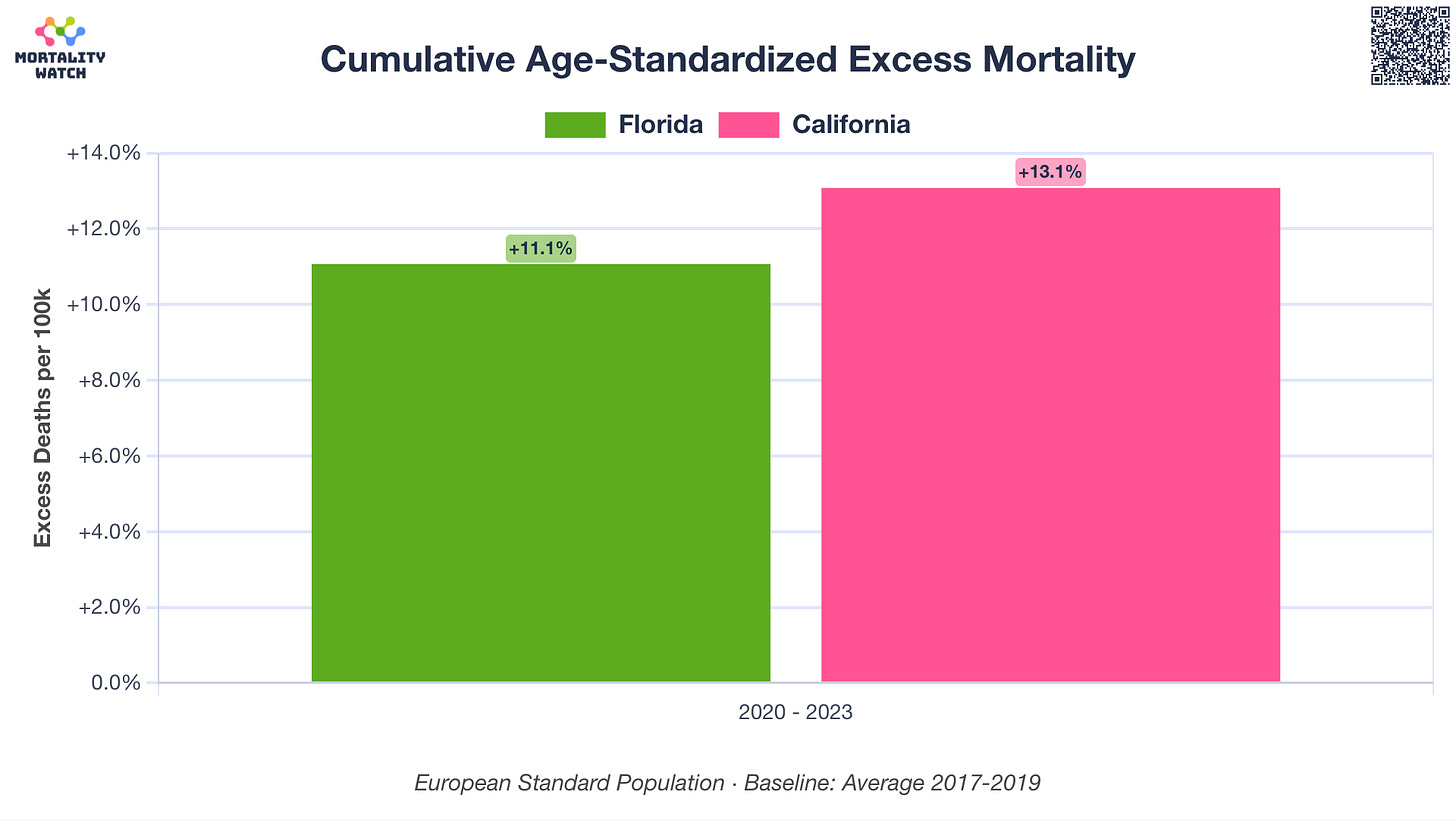
5. Florida vs California during COVID-19
Florida and California had very different public health approaches, but no significant difference in excess mortality.
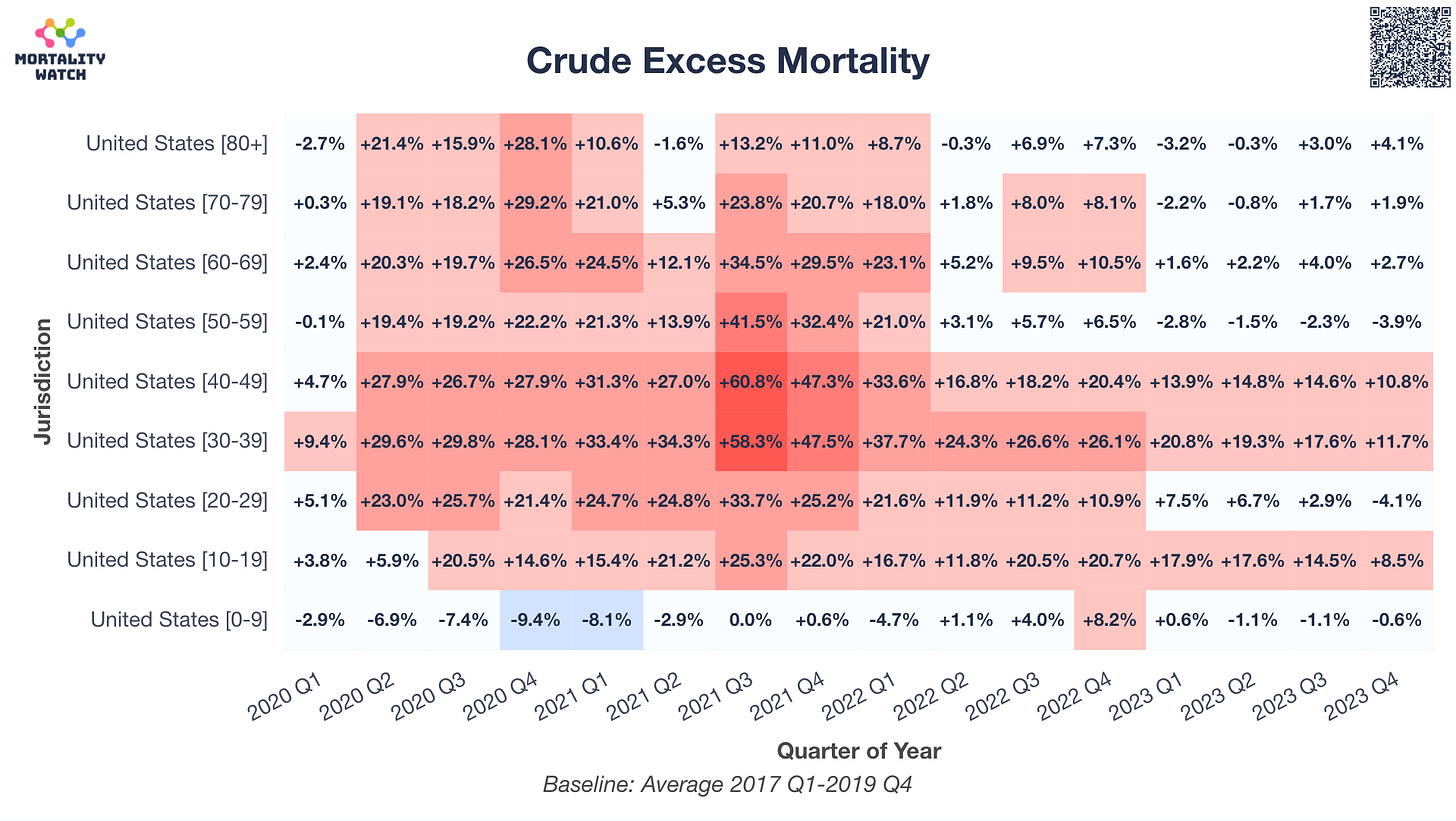
6. Excess Mortality by Age Group in the USA during COVID-19
Contrary to the risk profile of COVID-19, the USA recorded the highest relative increase in excess mortality in the working age population.
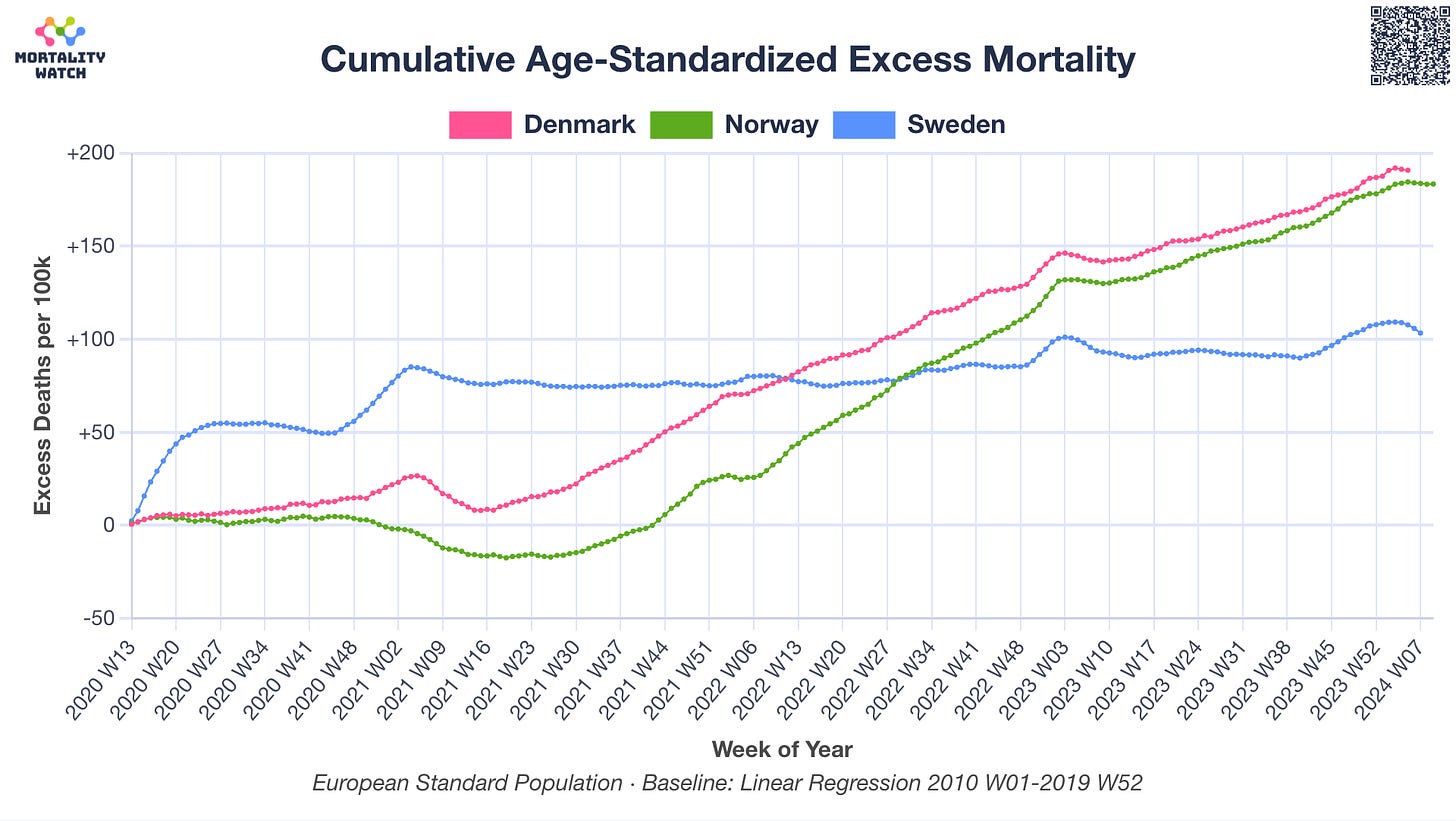
7. Excess Mortality in Scandinavia during COVID-19
While Sweden saw most of its excess mortality during 2020, its two Scandinavian neighbors saw much larger excess mortality later on.
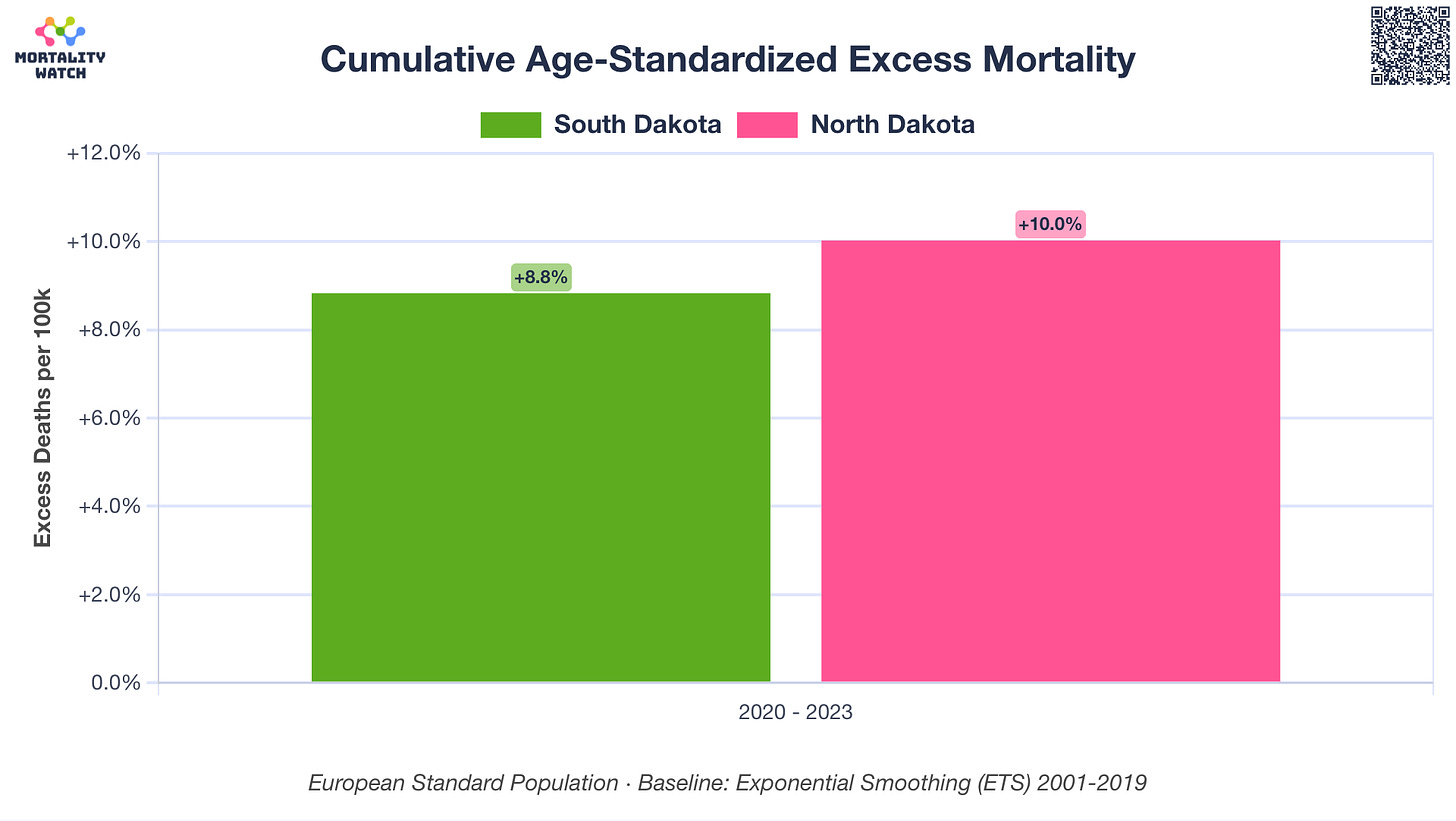
8. North vs South Dakota during COVID-19
Despite North Dakota's strict lockdowns and mask mandates, and South Dakota's lack thereof, both states saw similar COVID-19 outcomes.
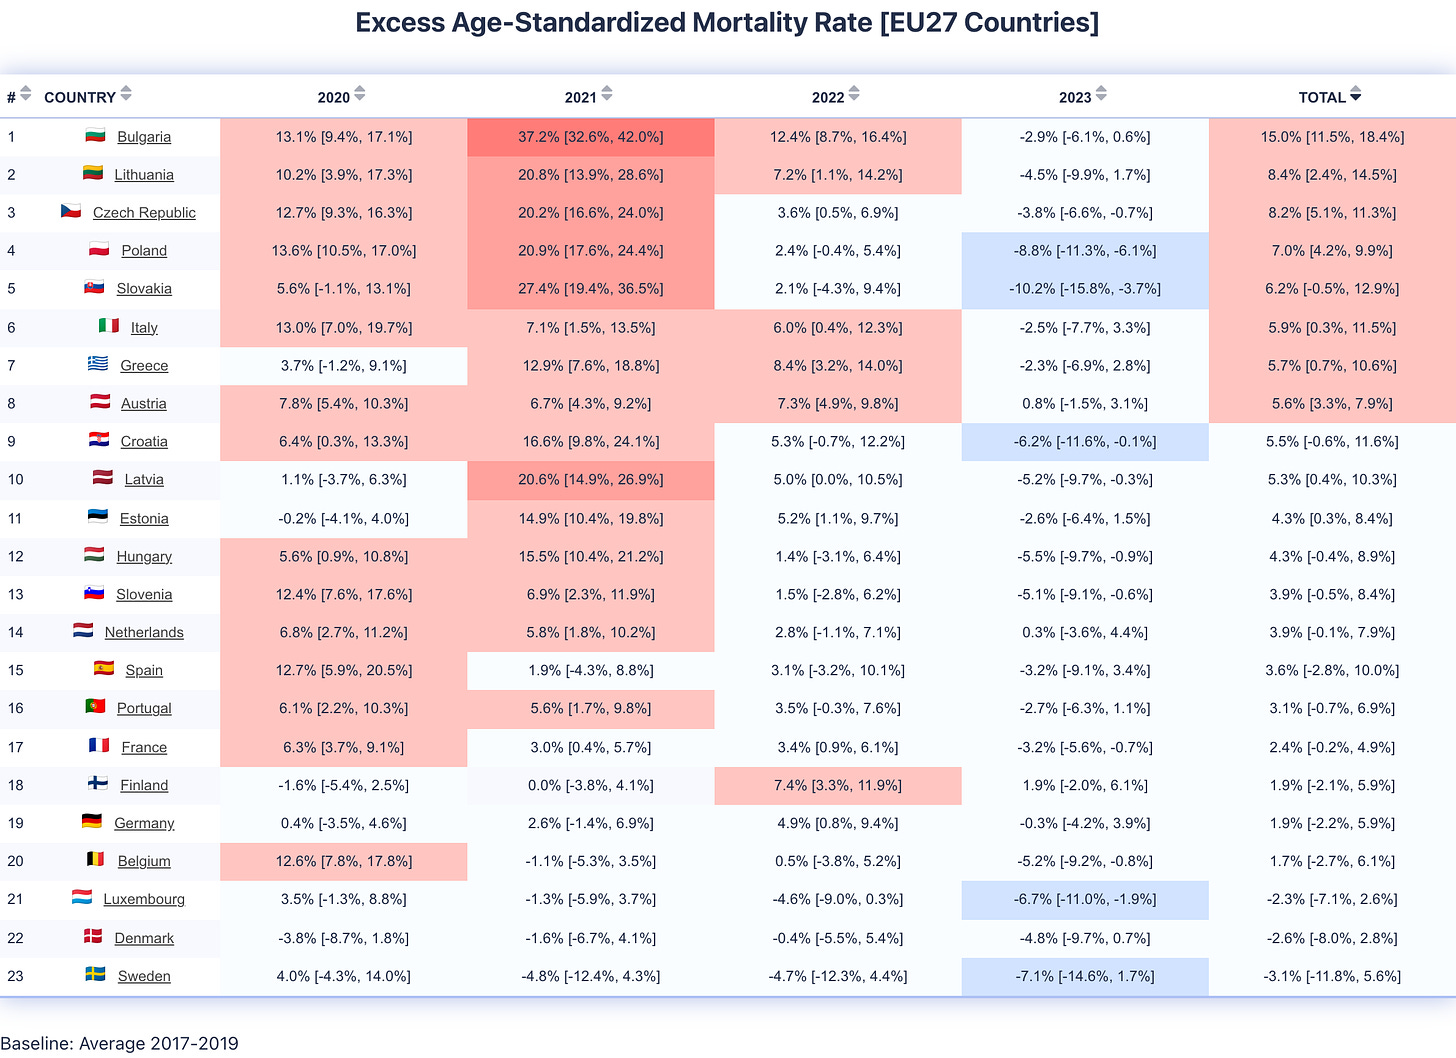
9. Excess Mortality Ranking in the EU during COVID-19
With a three-year average pre-pandemic baseline, only 11 of 23 countries recorded statistical significant excess mortality cumulatively during the pandemic years.
All charts were generated using the interactive tool Mortality.Watch where these charts are also featured on the front page now.
Let me know if you have other great charts to add!
If so, please share, title, description & URL in the comments below!


Counties and cities :)
Peter Halligan, did you know if you click & hold on the chart & select open in a new tab, you can enlarge the chart on the new tab. I only learned that a few months back from a kind online person, it helps a lot.