New Tool: De Bruijn graph genome assembly
A new tool that visualizes short read genome assembly using the De Bruijn graph algorithm and its potential issues!
I am excited to introduce a new tool that visualizes short read genome assembly using the De Bruijn graph algorithm. This tool showcases the theory behind the complex process of in-silico genome assembly, making it more accessible and understandable. This method was the primary method, that was used during the creation of the SARS-CoV-2 reference genome.
How the Algorithm Works
The De Bruijn graph algorithm is a widely used method for genome assembly, particularly used for handling short reads from sequencing technologies. Here's a step-by-step breakdown of the process:
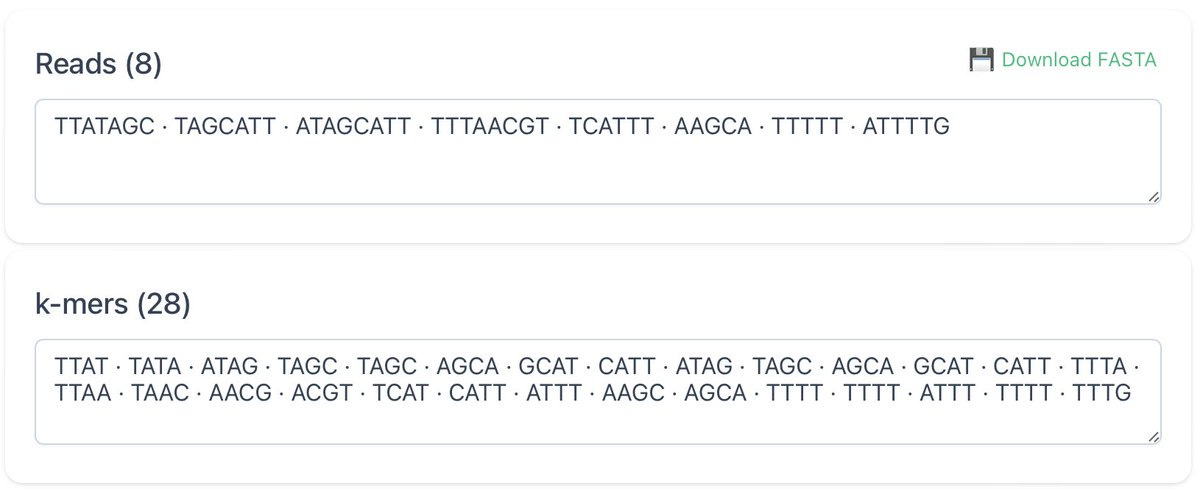
1. Reads Splitting into k-mers
The short genomic reads are divided into smaller, overlapping sequences of length (k), known as k-mers.
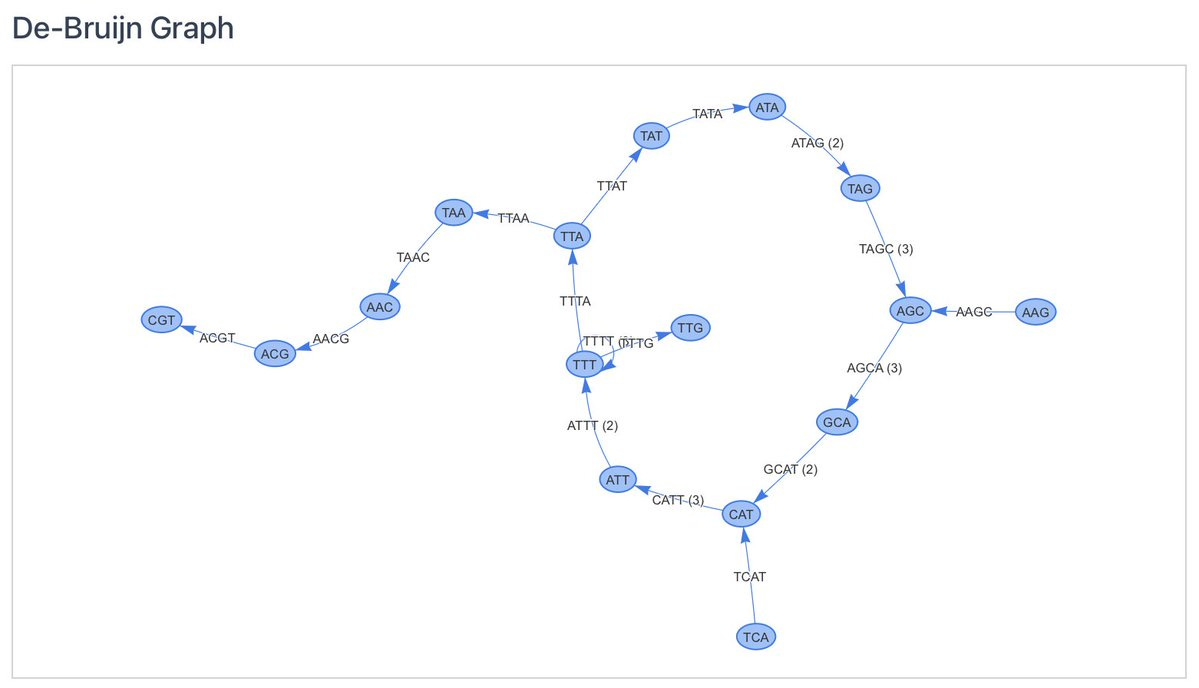
2. Constructing the Graph
Each (k-1)-mer represents a node in the graph. Edges are created between nodes based on the k-mers. Specifically, an edge is formed from one (k-1)-mer to another if there is a k-mer that bridges them (i.e., the suffix of the first (k-1)-mer matches the prefix of the second (k-1)-mer).
3. Traversing the Graph
The graph is traversed to find all possible paths, known as contigs. These paths represent all possible sequences of DNA that can be assembled from the k-mers, but do not necessarily have to exist in nature.
4. Result
The tool shows if the original sequence (i.e. that of a bacterium or virus) was found in the results (contigs) and if it matches the longest found contig.
Input Modes
The tool offers two input modes for flexibility:
1. Reads Mode
Users can define a list of genomic reads. This mode is suitable for working with sequencing data where the target genome is unknown and needs to be assembled from the provided reads.
2. Genome Mode
Users can define a reference genome. Based on this reference, the tool generates reads with added random noise to simulate additional genomic material (bacterial, human, etc.). This mode is useful for testing the assembly process and understanding how other genetic material might impact the assembly.
Data Download
Reads and contigs can be downloaded in FASTA format for further bioinformatic processing.
Overview of my Seven Part Genomics Series:
Summary
This tool provides a powerful way to visualize and understand the genome assembly process and its potential issues using the De Bruijn graph algorithm.
Please let me know your thoughts and feedback!


