Montana's Age Standardized Mortality Rates (2020-2023)
Unraveling Vast Differences in Excess Mortality & Lack of Correlation between COVID-19 Vaccination Rates
Background

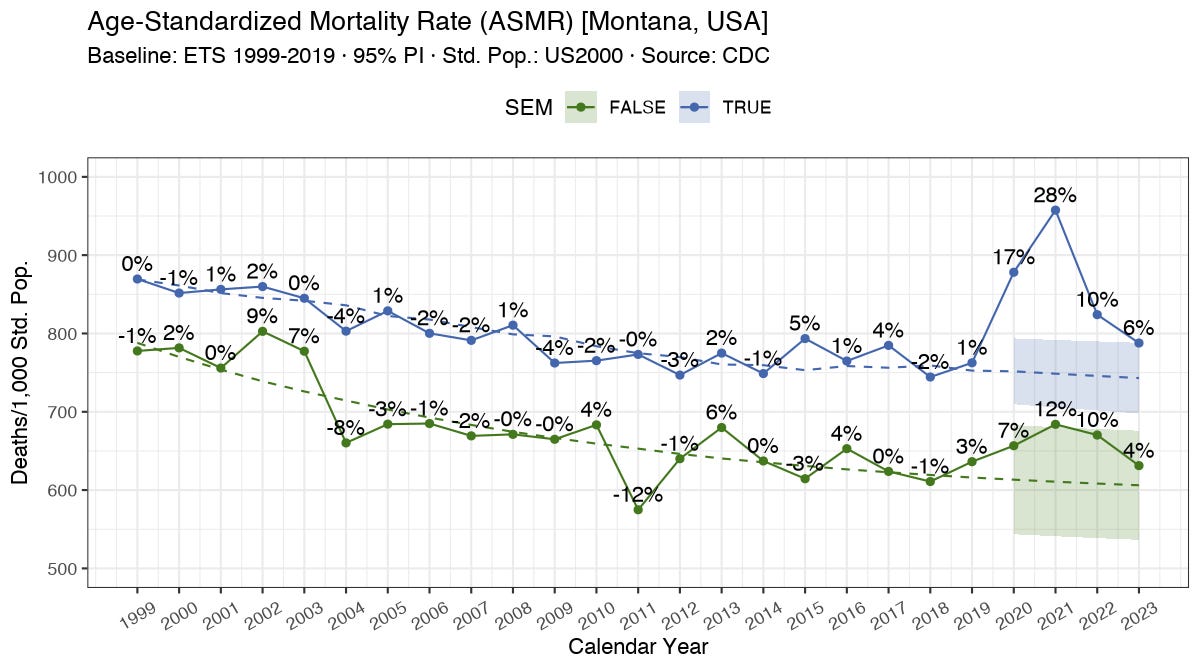
Montana, with a population of around 1.1M, saw up to 20% excess mortality during the years of 2020-2023. According to the yearly age-standardized mortality rate (ASMR), 2021, the year of the mass vaccination, recorded more excess mortality than 2020. (Figure 1, left) (1)
Methods
Mortality Watch Explorer was used for initial time series analysis. (1)
County level mortality & vaccination data were downloaded from CDC. (2, 3)
Seven different baseline models, using the R package fable (4), were employed to estimate excess mortality:
Last Value (2019) (5y)
Mean (3y & 5y)
Linear regression (10y)
Exponential Smoothing (ETS) (15y & 21y)
All models also calculate prediction intervals based on the observed variance (Figure 1: left - shaded red area, right - black bars). If the observed values of 2020+ are outside the range of the models’ prediction interval, they are not within the forecasted range, thus may be considered abnormal or as statistical significant excess mortality (SEM).
Results
Age Standardized Mortality Rates (ASMR)
In the monthly chart (Figure 1, right) we can observe two distinct waves of excess ASMR (eASMR). These waves last around six to seven months, are much more steady and last longer than any typical viral wave, that typically only lasts a few weeks. (ARI/ILI or wastewater observations). (9,10)
Calculating eASMR for each county with all models, we can identify counties that saw normal mortality patterns during a given year and abnormally high excess mortality (SEM). A map of counties by SEM model year shows vast differences between counties.
Using the ETS (21y) model for example, for all ages, 23 counties (41%) did not see any abnormal eASMR, while only 27% of counties recorded two or more years with SEM years. For ages 65+, that is 32 counties (57%) vs. 11 (20%).
Thus, one may conclude that, between 40-60% of Montana’s counties did not experience any significantly different excess mortality during the years of 2020-2023.
When grouping counties with and without SEM (Figure 3), the excess mortality barely reaches outside the 95% PI in 2021, and is only slightly higher than the years of 2002/’03. This is in stark contrast to counties with SEM that saw an up to 2.4x higher level of eASMR.
To rule out influence of the county size, population and population density were also correlated with excess mortality, which showed no statistical significant correlation at all. (R ~ [-0.1, 0.1]; p>0.05). (Appendix)
COVID-19 Vaccination
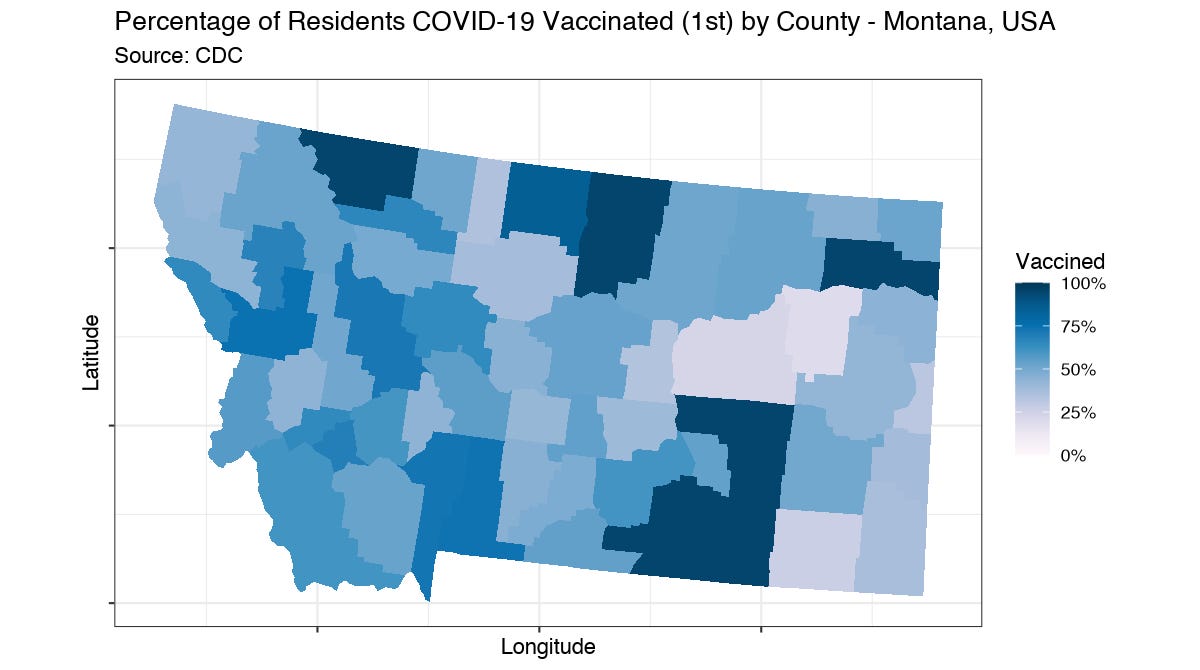
COVID-19 vaccination levels in Montana range from only 19% to 95%+ in five counties (Figure 4), thus making it ideal for a correlation analysis.
Correlating share of COVID-19 vaccinated population to excess mortality reveals no statistical significant correlation. For all ages, Pearson correlation: R=0.06, p=0.247. For ages 65+, Pearson correlation: R=0.07, p=0.238.
Splitting these out by year and dose yields the same effect: No statistical significant correlation can be observed in either direction.
Discussion
The initial eASMR pattern in Montana shows no abnormal increase until August 2020. This is odd, because other places such as New York saw massive increase (700%+) of eASMR in March/April 2020.
The length of the waves, with six to seven months, differs significantly to previously observed viral waves, as can be seen in wastewater measurements or previous flu waves. The first wave coincided with the all-present media coverage and high government lockdown stringency (5) while the second wave coincided with the onset of vaccination mandates & requirements starting in summer of 2021.
The fact, that about half of Montana’s counties did not see any abnormal change in mortality, and also the number of counties that saw excess in younger age groups was higher - suggests, that the causes are local events that have led to the increase. Other published research & initial analysis suggests that poverty, drugs and alcohol, may play the biggest role. While Injury, Overdose & Alcohol (IOA) related deaths in 2020 made up around 38%, that number rose to 68% in 2021 and all excess in 2022. (7, Appendix) Due to the lack of data on the relation between the underlying cause of deaths and the multiple cause of death (i.e. coded to 2019 ICD-10 standard), it cannot be rules out that many of these IOA deaths were coded as COVID-19 (U07.1) in the earlier years.
Lastly, no statistical negative correlation could be found for COVID-19 vaccination. Suggesting initial clinical trials findings of high efficacy, one would have expected counties with high vaccination rates to have significantly lower eASMR, which was not the case. On average, vastly unvaccinated counties did not record more deaths than vaccinated counties.
Similar analysis for European countries and German states by Ulf Lorré (6,7) also found no significant correlation and analysis by Prof. Reitzner/Kuhbandner for German states even showed a significant increase of mortality and stillbirths starting in early 2021 (8).
Summary
Age Standardized Mortality Rates (ASMR) in Montana and its counties from 2020 to 2023 were analyzed. No initial spring wave and two distinct waves of excess mortality, that lasted longer than typical viral waves, were observed. (9)
When examining excess mortality for each county, about 40-60% of Montana’s counties did not experience any significantly different excess mortality during these years. For all ages, 41% of counties did not see any abnormal excess, while only 27% of counties recorded two or more years with significantly elevated mortality rates. For ages 65+, that is 32 counties (57%) vs. eleven (20%). The causes of the abnormal change in mortality in some counties may be due to local events, as Injury, Overdose & Alcohol related deaths are making up a high share of the excess deaths, which are possibly driven by higher poverty levels in some counties.
COVID-19 vaccination levels in Montana varied greatly, ranging from 19% to 95%+ in different counties. However, no statistically significant correlation between the share of the COVID-19 vaccinated population and excess mortality was found. For all ages, the Pearson correlation was R=0.06, p=0.247. For ages 65+, the Pearson correlation was R=0.07, p=0.238. Despite initial clinical trials suggesting high efficacy of COVID-19 vaccines, no protective effect against excess mortality by high vaccination rates was found.
In summary, excess mortality was likely caused by local events, such as poverty related, injury, overdose & alcohol related deaths - and not a globally spreading novel risk-additive pathogen. Vastly unvaccinated counties did not perform worse than highly vaccinated counties.
Sources
https://www.mortality.watch/explorer/?c=USA-MT&df=1999&bf=1999&bm=exp&v=2
https://wonder.cdc.gov/
https://data.cdc.gov/Vaccinations/COVID-19-Vaccinations-in-the-United-States-County/8xkx-amqh
https://www.bsg.ox.ac.uk/sites/default/files/2020-12/BSG-WP-2020-034-v2_0.pdf
https://www.mortality.watch/charts/list.html#covid19-clinical-de
Appendix: https://docs.google.com/document/d/1Mc5q6qEvJdV4AHQS3853fq4iLMNnpRdUErMGa7f2sdI/edit?usp=sharing


Thank you for this. Is there any correlation between the excess IOA deaths and lockdown rules? also did the rules differ between counties?
Good work
Question: regarding "excess mortality was likely caused by local events, such as poverty related, injury, overdose & alcohol related deaths - and not a globally spreading novel risk-additive pathogen," what is meant by "poverty-related"? (May just be a grammar isssue there...)